A key part of developer experience when working with Vue has always been its amazing set of developer tools. With the release of Vue 3.1 @vue/compat build more and more applications are migrating to Vue 3, and thankfully the Vue 3 developer tools version is (at the moment of this writing) about ready to be fully released out of beta.
So if you are looking for a quick rundown of the new changes and features, stay with me and let’s dive right in. Depending on your learning style, you can watch the video version or read the text version below.
How to install the new developer tools in your browser
Getting access to the new developer tools is straightforward.
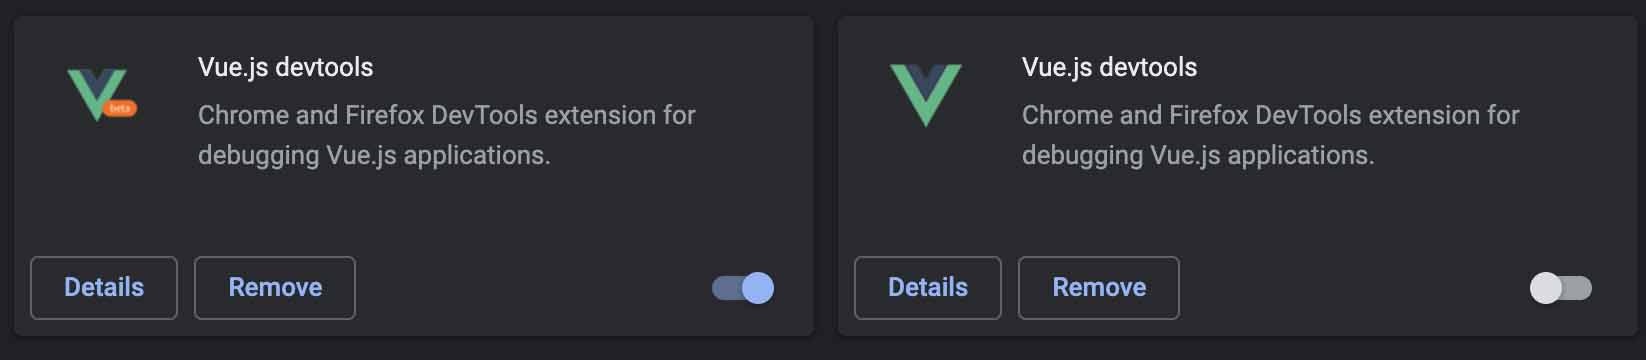
For Chrome, head over to this link and hit the install button. If you already have the older dev tools installed they will both be active and may cause some odd behavior, so make sure to turn the old version off.
For Firefox, head over to official repository’s change log and under assets download the .xpi file. The browser will prompt you to install the new tools.
The multi-app view
Go ahead and fire up a Vue 3 application (or Vue 2 because it’s also supported!) and open up the Vue tab on the inspector panel on your web browser of choice.
Likely one of the first things you will notice, other than its new sleek design, is the dropdown that says “App 1”.
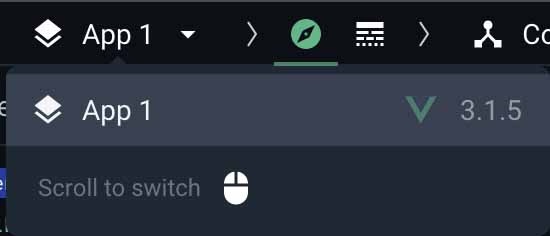
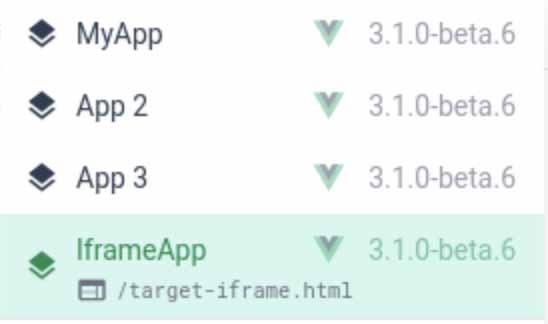
In browser pages with multiple Vue applications, you will be able to quickly swap between them, and have the ability to inspect Vue apps that are inside of an iframe.
The inspector tab
The main area where we inspect our components, the inspector, is now found by selecting this compass looking icon.

Component action icons
When selecting one of your components, you will see a set of three different icons on the top right hand side.

The first one with an eye on a box indicates Scroll to component. When clicking this icon your, browser will be scrolled to where the component is.
The second one indicated by the two <> means Show render code. When you click this icon, you will be able to see the Render function that is being used by the browser to render your component to the screen.
Finally, the hamburger icon with the < is the one I like the most, Inspect DOM. When you click this, your developer panel will automatically switch to the DOM inspector and highlight that component for you in the browser’s DOM. No more digging through the infinite div soup!
Fragmented root components
Another new change you may notice is that some components have the fragment pill label shown on their right hand side.

This indicates that this component is a fragmented root component (commonly known as multi-root components).
Performance indicators
Next up is the performance pill. When you have a component in your application that is not performing very well because its rendering is slow, you will get a handy pill next to it indicating the time it took to render or patch.
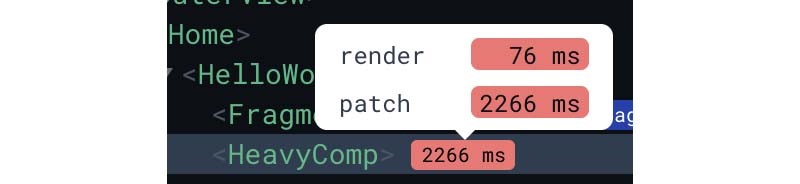
You can see an extended tooltip with more information when hovering over it as shown on the above image.
Router link routes
Another new pill that you may see next to your components is the route indicator for RouterLink components that are created with Vue Router.

This new feature is extremely helpful when quickly inspecting your component tree to figure out how your navigation is set up. Curiously enough though, this feature is not directly added by the Vue tools themselves but by Vue Router!
Plugins for Vue Tools
One of the most exciting parts of the new Vue tools is that it comes fully ready to be integrated with external plugins. This means that library authors can now incorporate their libraries to have special panels, pills, and information displayed directly on your Vue developer tools.
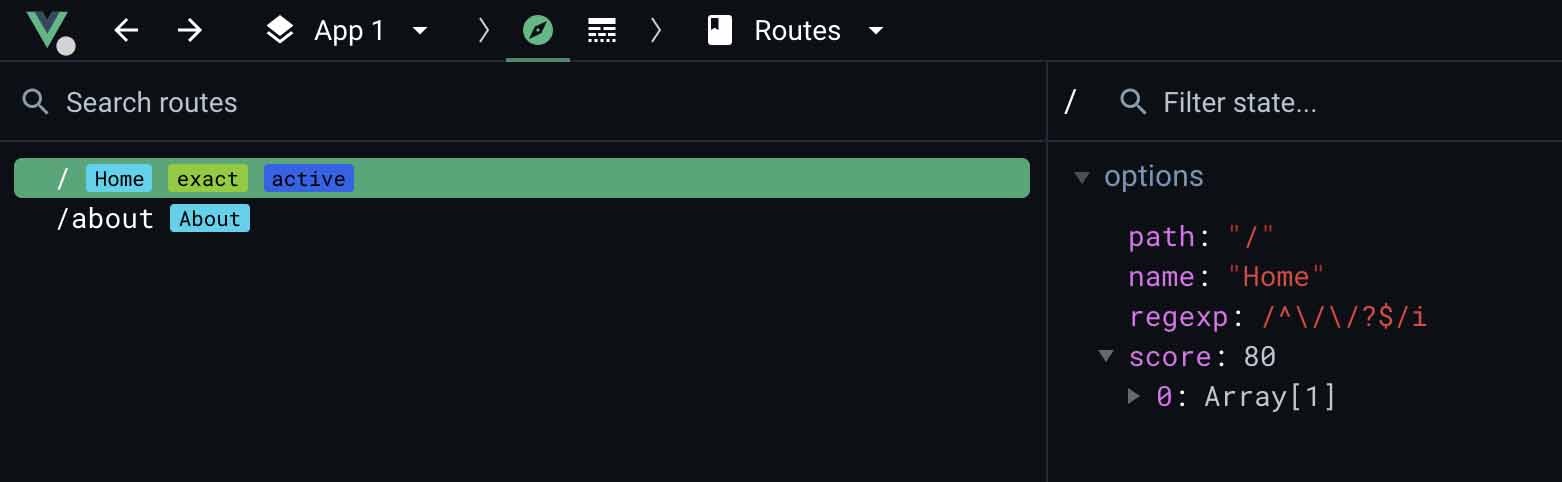
Two libraries that are already ready to use this new system are Vuex and Vue Router. If you click under the Components dropdown on an application that is using either, you will see a list of enabled plugins (indicated by the jigsaw piece throughout the tools).
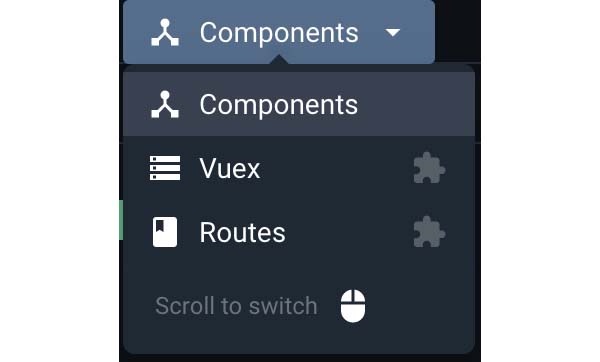
When clicking into one of these panels, you will see a custom view for that plugin. For example, the Vue Router panel shows us a list of our current available routes.
If you are interested in creating your own plugins, or reading about the process, the devtools’ official docs now has a Plugin Development Guide.
The Timeline
On the right of the inspector icon, you will notice an icon that looks like brick buster or space invaders (😂). This is the new event timeline.

When you first open it (and if you haven’t interacted much with your application) you will see a blank central area with color-coded bullets on the left.
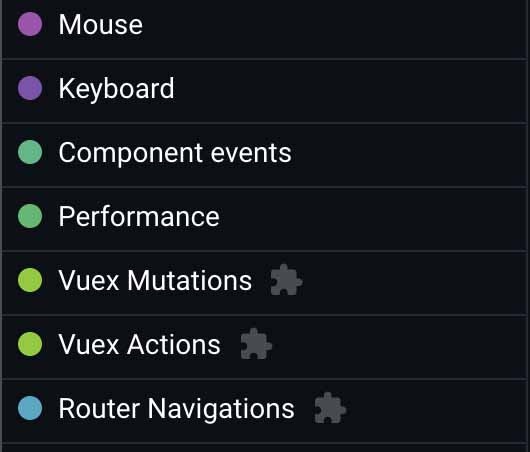
Each of these color-coded “lanes” will display a timeline of events that your application is firing in real time.
For example, if I click on one of my router-link components, the following dots will appear on the right-hand side where the actual timeline is.
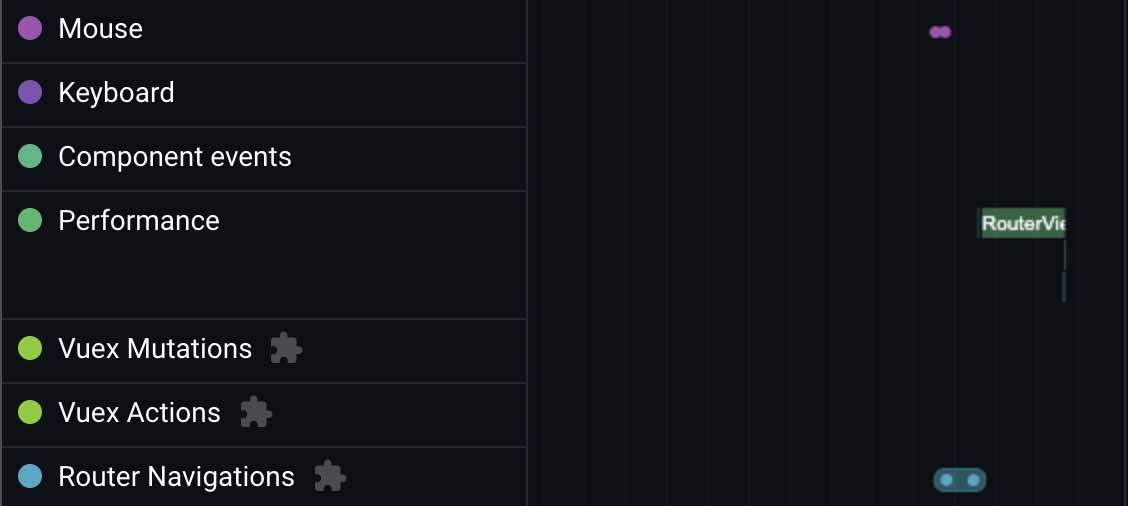
This may not seem like much at first sight, but there’s a lot of information packed in these little dots.
If I click on one of the purple Mouse events, a third panel on the very right displays the following information:
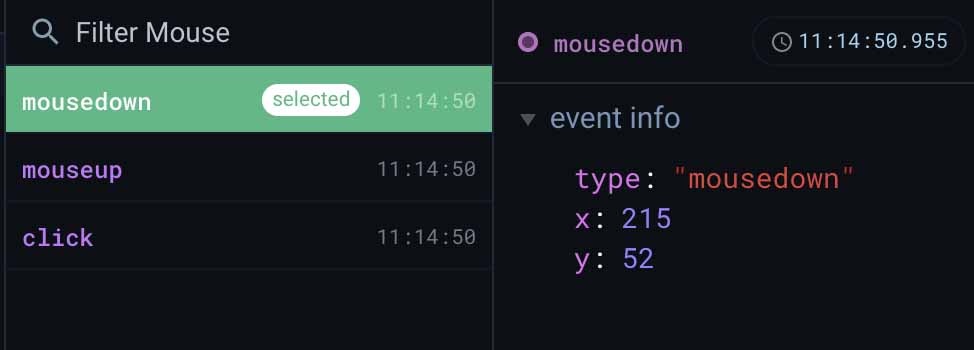
Not only was my click event registered, but also my mouseup and mousedown events that wrapped that click. We even get the x and y coordinates as captured by the mouse event.
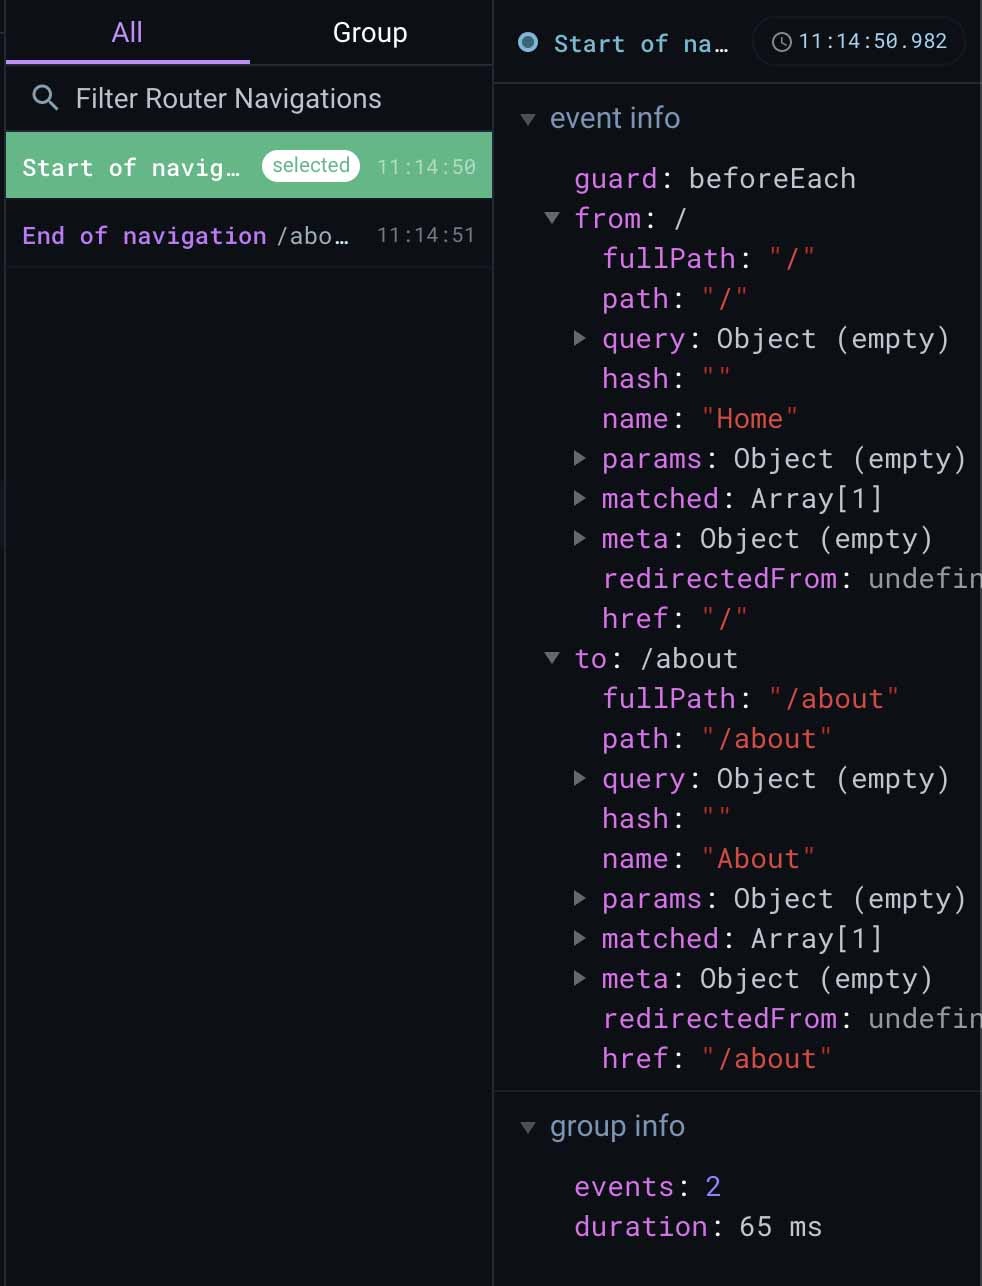
The blue circles in the Router Navigation lane include a lot more information, as it is an event customized by the Vue Router plugin.
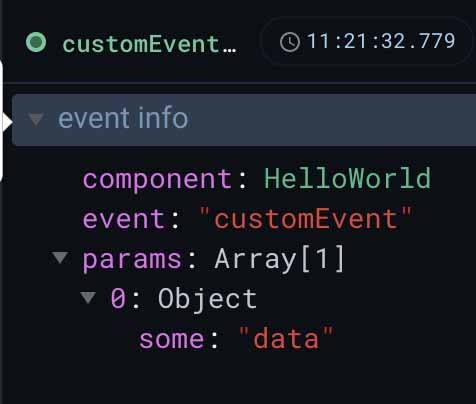
Component events will also display the full payload information. For example, a click event on a simple button like this one:
<button @click="$emit('customEvent', { some: 'data' })">Click me</button>
Will display the following information.
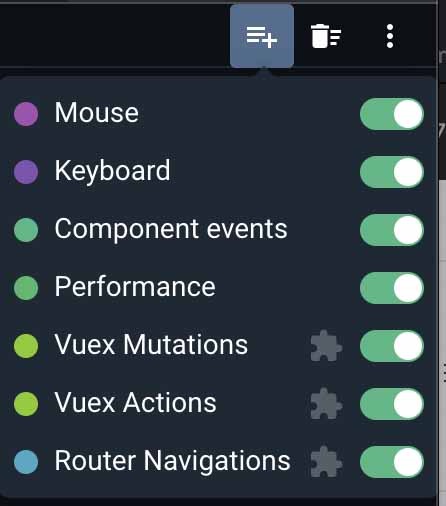
If you are getting overwhelmed by all the layers in the timeline, or just dealing with an application with a lot of complexity, there is a helpful little button on the top-right corner of the timeline area that allows us to turn off or turn back on individual layers of the timeline.
Open in editor
I have saved my favorite feature for last: the Open in editor button.
When you select one of your custom components in the inspector (by custom I mean not things like router links, or library components) you will get an icon of a box and an arrow coming out of it on the far right.
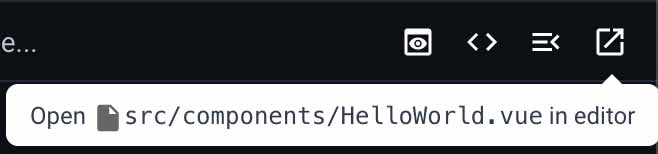
If you click this button, your editor will open with the file that corresponds to that file! Whaaaat?
Note that this works out of the box for Vue CLI, Nuxt, and Quasar CLI projects. If you’re working on a custom webpack solution or NodeJS you will need some extra setup.
Wrapping up
This concludes our overview of the most notable new features of the new devtools. There’s a lot to unpack and explore here, so I highly recommend you start using the tools as soon as possible and clicking around to discover all the little quality-of-life improvements that the devtools team has added to this already amazing tool.
Links:
- Firefox xpi file - https://headwayapp.co/vue-js-devtools-changelog
- Plugin Development Guide - https://devtools.vuejs.org/plugin/plugins-guide.html
- Open in editor documentation - https://devtools.vuejs.org/guide/open-in-editor.html